Ohio State Endowment Returns 16.03% in Fiscal 2026 but Trails Its Policy Benchmark by 1.05 Points
Ohio State's $9.7 billion endowment pool returned 16.03% in the year to 30 June 2026, against a preliminary benchmark of 17.08%. Over five years it is ahead, at 9.17% a year against 7.81%.
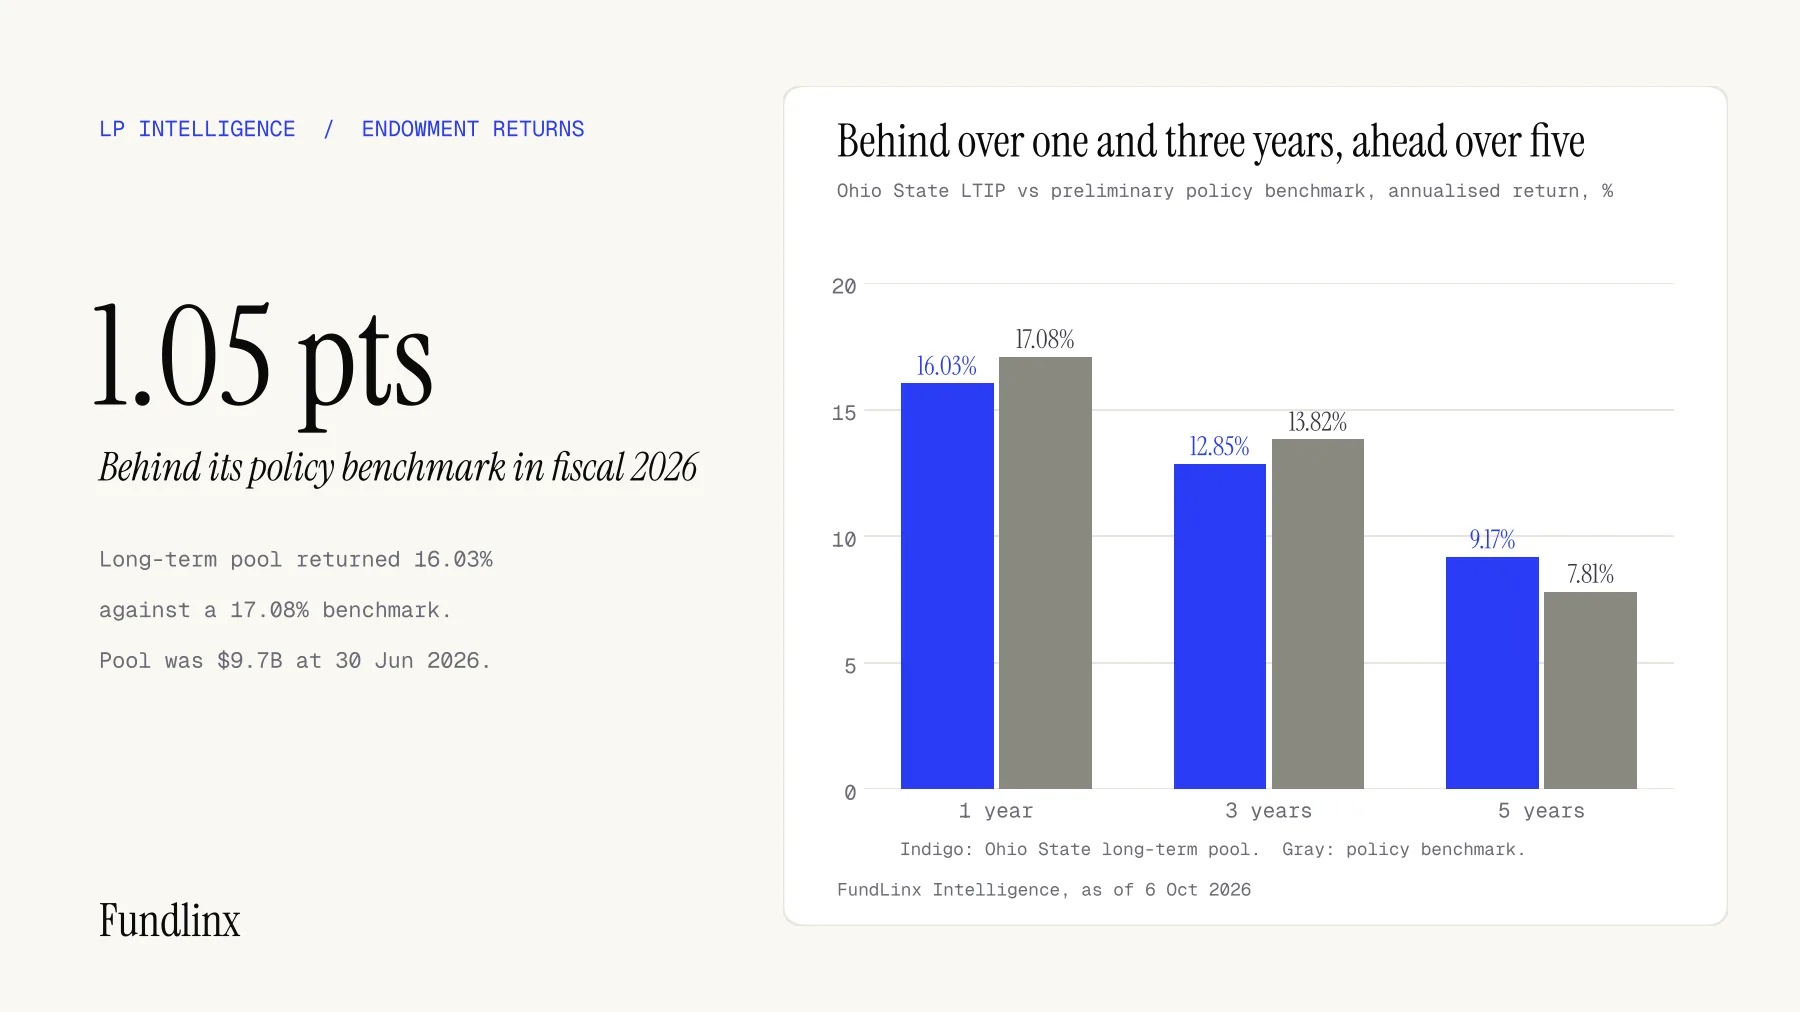
The Ohio State University endowment returned 16.03% in the fiscal year to 30 June 2026, according to figures its investment office has posted. The Long-Term Investment Pool, which holds thousands of the university's endowment funds, was worth $9.7 billion at that date. Its preliminary policy benchmark returned 17.08%, so the pool finished 1.05 percentage points behind. The benchmark figures are preliminary: the office says final benchmark returns are published about four months after the fiscal year ends, so the gap may move. Distributions to the university in fiscal 2026 were $339 million, which is about 3.5% of the pool by our arithmetic.
What the numbers show
The longer record is more mixed than the one-year figure. Over three years the pool returned 12.85% a year against a benchmark of 13.82%, a shortfall of 0.97 points. Over five years it returned 9.17% a year against 7.81%, which is 1.36 points ahead. So the pool has lagged its benchmark over one and three years and led over five, a pattern that often points to a strong run in the earlier part of the window that is now rolling out of the calculation.
The pool's targets explain why the benchmark matters to managers. The long-term policy sets 32.5% for public equity, 32.5% for private equity, 10% for real estate and infrastructure, 12.5% for hedge funds and credit, and 12.5% for cash and high-grade bonds. That makes 75% of the pool equity-oriented and 25% diversifying. Private equity is allowed to range between 15% and 40%, so the target sits in the upper half of its band. At 32.5% of $9.7 billion, the private equity sleeve at target would be about $3.15 billion, though the office has not said what it actually held on 30 June.
How this compares with other fiscal 2026 results
Ohio State's return sits well below the headline numbers from the other large endowments we have covered this season. Stanford returned 31.7%, Penn returned 27.4%, and MIT returned 10.3%. That spread is roughly 21 points between the top and bottom of those three, and Ohio State falls between MIT and Penn. A single headline return says little on its own, since the difference often comes from how much each pool holds in a handful of large venture positions. We covered that spread in our look at how six endowments landed 27.5 points apart.
The more useful comparison is each pool against its own policy portfolio. Ohio State's 16.03% against 17.08% says the active decisions in fiscal 2026 cost about a point, and the five-year numbers say the same decisions have added value over the longer run. Boards and investment committees usually judge an endowment on the longer figure, which is the one a GP should cite back to them.
The LP behind the pool
The Office of Investments is led by Vishnu Srinivasan, Vice President and Chief Investment Officer. The office describes its method as a diversified allocation model in five categories, run with external managers and their specialist teams from around the world. The pool exists to support student scholarships and other university priorities, and the office says endowments generate more than $66 million a year for scholarships alone. Ohio State is a university endowment, and you can compare it with other university endowment LPs by size and allocation. We have not seen a stated ticket size or a statement on emerging managers from the office, so those should be treated as unknown.
What GPs should do now
First, frame your pitch around the policy benchmark. Because this LP reports against a fixed policy portfolio, a pitch that shows how your fund behaves relative to a public equity or buyout benchmark in strong years and weak years speaks to the test the investment committee will apply.
Second, speak to liquidity. The pool paid out $339 million in a year. An LP in that position needs cash back from its private equity sleeve, so a GP should be ready to show DPI, the pace of realisations and the timing of any expected exits, not only net IRR. Our piece on endowment results season as an outreach window covers what to send a CIO after a year like this one.
Third, match the sleeve. A 32.5% private equity target with a wide 15% to 40% range gives the office room to add or hold back depending on valuations. A GP raising a buyout or growth fund should say how its strategy fits the range, rather than leave the office to work it out.
Fourth, do not read the one-year gap as a signal to cut private equity. The five-year lead suggests the opposite, though the preliminary benchmark means any firm view should wait for the final figures.
What to watch next
Watch for the final benchmark returns, which the office says will follow about four months after the fiscal year-end, and for any change to the long-term targets. FundLinx members can see which endowments are adding to private equity.
FundLinx Intelligence | FundLinx.ai